
The 2024 edition of the “State of the Global Climate” report by the World Meteorological Organization (WMO) provides a comprehensive and highly detailed overview of climate trends observed in recent years. The document—covering key indicators such as greenhouse gas concentrations, global temperatures, ocean warming, sea level rise, and many others—serves as a fundamental resource for understanding the challenges our planet is facing.
Dissemination of up-to-date data and analyses, based on rigorous scientific methodologies, is crucial for informing governments, institutions, businesses, and citizens about ongoing transformations.
This report sounds an “alarm bell”: the average global warming last year reached 1.55°C ± 0.13°C compared to the pre-industrial period (1850–1900), breaking the 2023 record. Since this is only one year, this surpassing of the 1.5°C threshold does not necessarily mean that the limits of the Paris Agreement have been exceeded.
Below, we analyze the global climate trends in 2024 highlighted in the report.
Greenhouse gas emissions
The document begins by analyzing greenhouse gas concentrations in the atmosphere.
- Carbon Dioxide (CO₂): In 2023 (the most recent year for which data is available), the global average concentration reached 420.0 ppm (parts per million), surpassing the previous record and representing 151% of pre-industrial levels. This increase, along with the annual growth recorded in 2023 (2.8 ppm), underscores how anthropogenic emissions (from fossil fuel combustion, cement production, and deforestation) are among the primary drivers of climate change.
- Methane (CH₄) and Nitrous Oxide (N₂O): These two gases also reached record levels, with CH₄ at 1,934 ppb (parts per billion) and N₂O at 336.9 ppb, representing 265% and 125% of pre-industrial levels, respectively.
During the period 2014–2023, 48% of human emissions remained in the atmosphere, indicating that this value is set to increase in the absence of decisive interventions, threatening the ability of natural ecosystems to absorb CO₂.
Global temperatures: records and new perspectives
The report continues with an analysis of global temperatures:
- Global Warming: 2024 has been confirmed as the hottest year in the 175 years of recorded data. These data show an anomaly of 1.55°C ± 0.13°C compared to the pre-industrial period. The previous hottest year was 2023, and, though not in exact order, the 10 years from 2015 to 2024 are the hottest ever recorded. The following graph clearly shows the sharp upward trend in recent years, regardless of the data set considered.
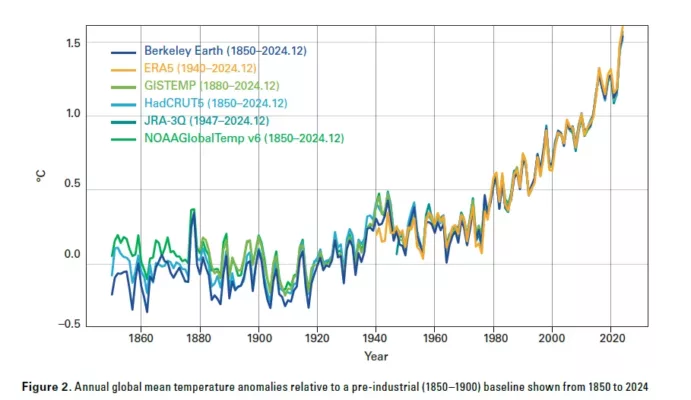
- Effects of El Niño: A strong El Niño event, peaking in the early months of 2024, further contributed to rising temperatures and climate anomalies. Every month between June 2023 and December 2024 recorded average temperatures above historical levels, confirming the interaction between natural phenomena and the long-term warming trend.
Ocean warming: a storage of excess energy
Ocean heat content data reveal that:
- Record heat content: 2024 set a new record for ocean heat content, surpassing the 2023 record by 16 ± 8 ZJ. Every year in the last eight years has been a record year.
- Accelerated increase: Over the past two decades (2005–2024), ocean warming has occurred at more than twice the rate of the previous period (1960–2005).
- Environmental consequences: Ocean warming not only destabilizes marine ecosystems, contributing to biodiversity loss and reducing CO₂ absorption capacity, but it is also responsible for sea level rise.
The report reiterates that while about 90% of excess energy is absorbed by the oceans, the consequences of this phenomenon are irreversible on centennial time scales.
Sea level rise: an accelerating trend
The section on sea level highlights key aspects:
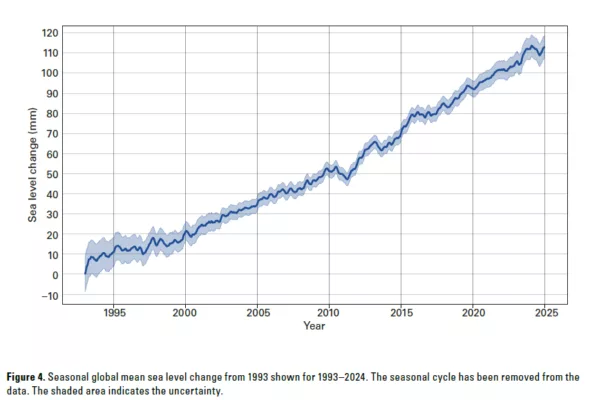
- Satellite data and records: Since 1993, satellite monitoring has recorded a continuous increase in the global average sea level, which has doubled from the period 1993–2002 to 2015–2024, reaching 4.7 mm/year.
- Variability and natural phenomena: The El Niño–La Niña phenomenon plays a key role in annual fluctuations in sea level, as El Niño conditions tend to temporarily raise sea levels while La Niña lowers them.
This rising trend, combined with extreme events, leads to increasing risks for coastal communities, with direct impacts on infrastructure, ecosystems, and food security. The following graph clearly illustrates the trend of recent years.
Ocean acidification
The document also analyzes ocean acidification, a phenomenon resulting from the absorption of a significant portion of CO₂:
- pH decrease rate: From 1985 to 2023, the average surface ocean pH decreased at a rate of –0.017 ± 0.001 units per decade, indicating an ongoing acidification process.
- Regional disparities: Not all oceans acidify at the same rate: the Indian Ocean, the Southern Ocean, and some areas of the Pacific and Atlantic show more pronounced variations.
Acidification has devastating effects on marine organisms, particularly those that build skeletons and shells (such as corals, mussels, and barnacles). This brings repercussions on the entire marine food chain and fishing and aquaculture activities.
Glacier mass balance: climate change indicators in 2024
Data on glacier mass balance serve as a critical indicator of climate change:
- Record negative balances: The period 2021/2022–2023/2024 recorded the most negative mass balance in the last 70 years, with most glaciers continuing to lose mass at an accelerating rate.
- Critical areas: Particularly concerning are data from regions such as Scandinavia (Norway, Sweden, Svalbard) and the tropical Andes, where glacier retreat is particularly pronounced.
This acceleration in glacier mass loss significantly contributes to sea level rise and poses risks to local water resources.
Sea ice coverage
The report dedicates an entire section to the variation in ice coverage in polar regions:
- Arctic: In 2024, the minimum daily extent of Arctic ice was the seventh lowest in the satellite record. The declining trend, approximately 14% per decade compared to the 1991–2020 average, highlights the vulnerability of this area. The 18 lowest values recorded have all occurred in the last 18 years.
- Antarctic: Similarly, in Antarctica, both minimum and maximum ice extents were below average, with the minimum reaching historically low levels for the third consecutive year.
This reduction in sea ice coverage has cascading effects on the global climate, impacting ocean circulation, surface reflectivity (albedo), and the stability of polar ecosystems.
The ENSO phenomenon: the 2024 climate between La Niña and El Niño
One of the most influential climate drivers is the El Niño–Southern Oscillation (ENSO):
- Phase transition: After three consecutive years of La Niña, a strong El Niño event emerged in 2023, peaking between November 2023 and January 2024 before weakening throughout 2024.
- Regional and global impacts: El Niño contributed to rising global temperatures and altered precipitation patterns, causing droughts in some regions (such as North Africa and parts of South America) and heavy rainfall in others.
Although these oscillations are natural phenomena, they interact with global warming, intensifying extreme effects and creating challenges for disaster management.
Temperature and precipitation patterns: a map of 2024 climate anomalies
The report presents maps and detailed analyses of temperature anomalies and precipitation variations:
-
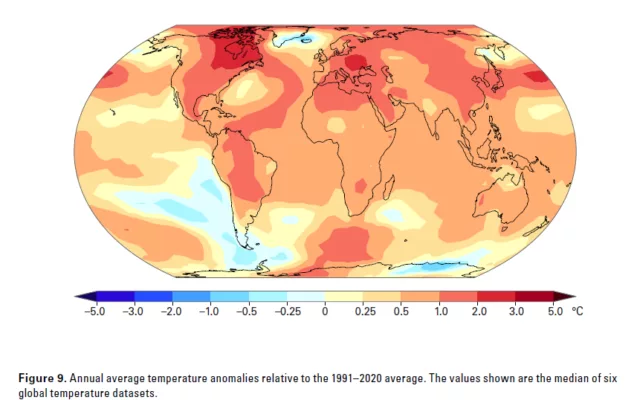
Thermal distribution: Throughout 2024, most land areas experienced temperatures above the 1991–2020 average. Record heat was observed in vast tropical and subtropical regions, while some areas, such as Iceland and parts of Antarctica, reported below-average temperatures.
-
Anomalous precipitation: The year 2024 showed a diverse pattern: regions like South Africa, parts of North Africa, and sections of South America suffered from a lack of precipitation, while others, including Central Europe and some Asian areas, recorded above-average rainfall.
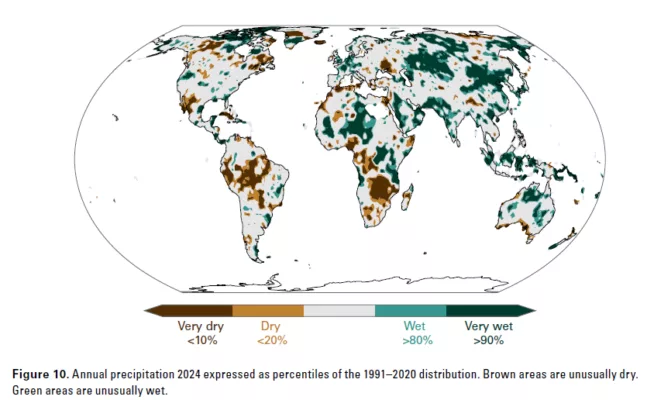
These patterns highlight how the global climate is becoming increasingly “chaotic,” with extreme events alternating with drought periods.
High-Impact Events: climate disasters and social consequences in 2024
One of the most striking aspects of the report concerns extreme weather events and their impacts:
- Displacements and humanitarian impacts: 2024 recorded the highest number of new population displacements since 2008, driven by extreme events affecting infrastructure, housing, and natural resources.
- Notable events: Among the most significant events were:
- Tropical cyclones and hurricanes: typhoon Yagi in Southeast Asia, hurricanes Helene and Milton in the United States, and cyclone Chido in the Indian Ocean caused severe damage and hundreds of casualties.
- Floods and inundations: From the Middle East to Sub-Saharan Africa and Europe, heavy rainfall led to widespread flooding, agricultural damage, and significant economic losses.
- Droughts and heatwaves: Conversely, droughts in regions such as the Sahel and parts of Southern Africa underscored the consequences of reduced precipitation, exacerbating food and water crises.
- Wildfires and heatwaves: In North America, Canada, Latin America, and parts of Europe, heatwaves and wildfires posed a constant threat, with economic and health repercussions.
These extreme events, intensified by a combination of anthropogenic and natural forces, underline the urgency of investing in early warning systems and resilient infrastructure.
Global temperature monitoring for the Paris Agreement
A key area of interest is the continuous monitoring of global warming in relation to the targets set by the Paris Agreement:
- Innovative methodologies: To assess whether the average global warming has exceeded the 1.5°C threshold relative to the pre-industrial period, three complementary methodologies are used. These include historical data analysis, climate model-based projections, and estimates of human-induced forcings.
- Results and uncertainties: The methods converge on estimates that, while remaining below the 1.5°C limit, do not rule out the possibility that this value has already been surpassed on average, considering statistical uncertainty.
- Political and scientific challenge: The need to define and precisely monitor warming thresholds is highlighted as a priority to translate scientific progress into concrete policy actions.
Future outlook
The 2024 climate report provides a concerning yet essential overview: the planet is undergoing an accelerated warming phase and unprecedented environmental changes.
- Urgent need for action: Every fraction of a degree of warming carries greater risks, with cascading effects on biodiversity, food security, human health, and economic stability.
- Early warning systems and resilience: Investment in monitoring infrastructure, forecasting technologies, and early warning systems is crucial to mitigating the impact of extreme events.
- Role of environmental policies: Translating scientific evidence into effective global policies is the key challenge in addressing climate change while honoring international commitments such as those outlined in the Paris Agreement.
Brochesia for sustainable collaboration
The in-depth analysis offered by WMO in the 2024 climate report reminds us that climate change is a complex phenomenon. The process is driven by a multiplicity of both natural and anthropogenic forcings. Each paragraph of the document not only presents data and trends, but also invites reflection on the urgency of coordinated global action.
As the urgency to reduce emissions and improve operational efficiency becomes increasingly critical, Brochesia is an ideal partner for the transition to sustainable collaboration. Our digital solutions enable companies to optimize internal processes and significantly reduce the need for physical travel. In doing so, organizations find significant benefits. Not only do they improve their productivity, but they also contribute to a decrease in CO₂ emissions, promoting a more sustainable operating model that is in line with the challenges of climate change. By integrating our technologies into everyday processes, Brochesia helps build a future in which innovation and sustainability walk together toward greater environmental resilience and market competitiveness.
Contact us to know more on how your operations can become more sustainable with our AR software.